Software
Services
Resources
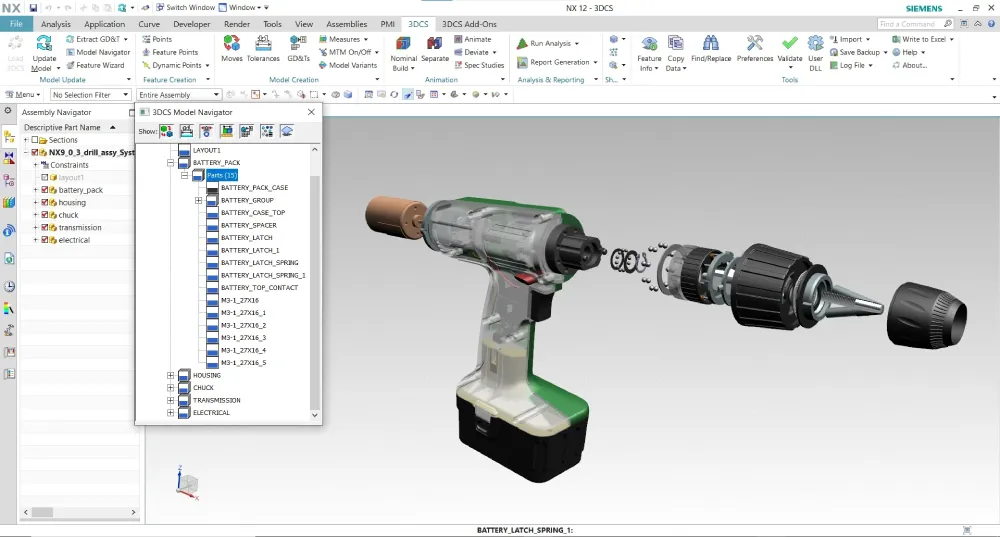
Tolerance Analysis fully integrated into Siemens NX CAD Software


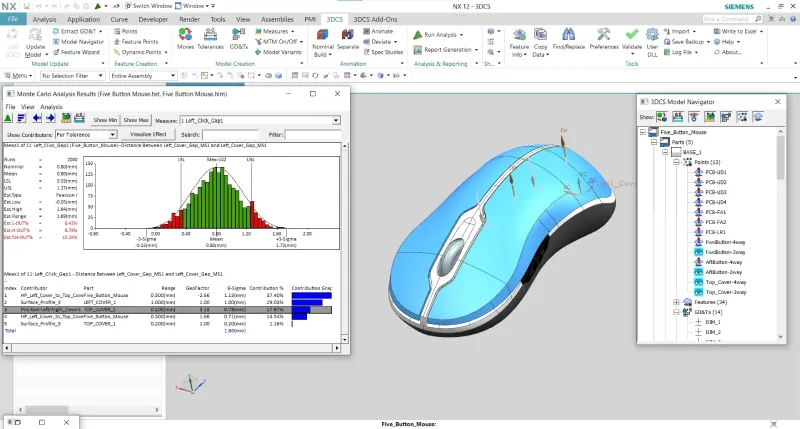
3DCS Variation Analyst for NX is an integrated software solution integrated into Siemens NX CAD that simulates product assembly and part tolerance 3D stack-ups through Monte Carlo Analysis and High-Low-Mean (Sensitivity) Analysis.
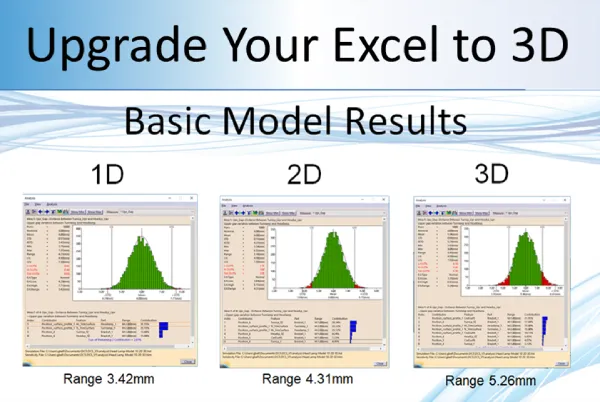
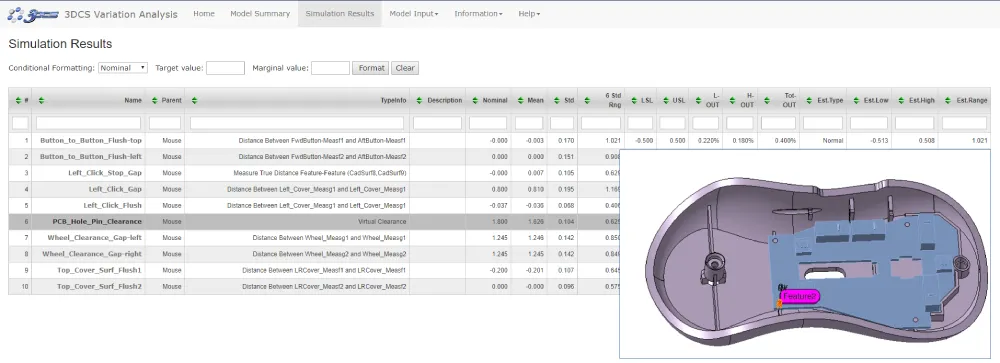
3DCS for NX gives outputs based on part and process variation. These can be input in a variety of ways, from CAD-based PMI to selecting from applicable feature or point-based options in 3DCS. The final results are shown as statistical (Monte Carlo) and mathematics (GeoFactor) based outputs with toggle-able metrics like Cpk, Ppk, ranges, percent out of specification, and a variety more.
What helps 3DCS for NX stand out is its connection to Siemen’s Teamcenter PLM system. Not only is 3DCS for NX integrated into NX CAD, but it in turn is integrated with Teamcenter. The 3DCS analysis data is stored in the NX CAD model, meaning that any place the model is stored or managed takes the 3DCS data along with it. This makes it easy to store your model and 3DCS data in Teamcenter, handling both version control and data security.
Integrated CAD tools provide a streamlined approach to analysis that improves adoption, training, and process implementation. With the ability to open 3DCS for NX in the CAD platform, and utilize PMI, GD&T, and CAD characteristics, implementation of 3DCS as a tolerance analysis tool becomes easy to learn and apply.
With an integrated modeling approach, 3DCS saves the analysis data in the model files, letting users manage their CAD model in leading PLM systems like Teamcenter, Windchill, Enovia, and 3DEXPERIENCE and automatically bring their tolerance analysis along. This answers the challenge of both file management and version control.
3DCS for NX uses three methods of simulation;
1. Monte Carlo Simulation
2. High-Low-Median (Sensitivity analysis)
3. GeoFactor (RSS equation) Analysis
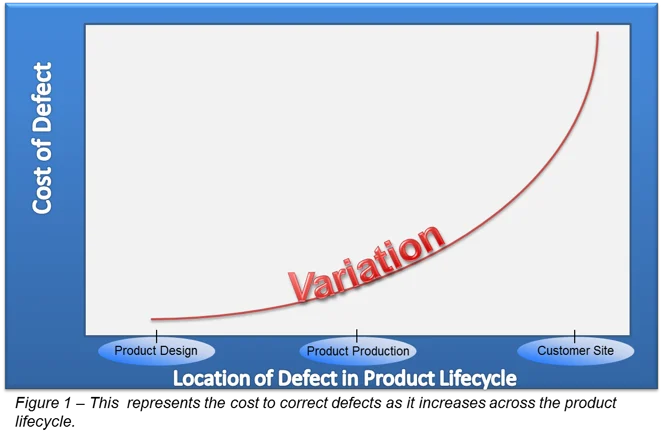
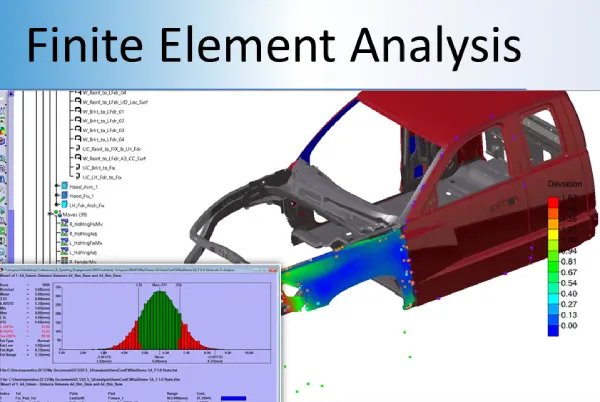
By accurately modeling the assembly, you can see how both the assembly process and the part tolerances contribute to the product’s overall variation. Together, this creates a virtual prototype that can be used to make decisions about design changes and tooling while reducing non-conformance that leads to scrap and rework.
Simulating products in a digital environment gives engineers the ability to account for variation in key areas; reducing rework, non-conformance, and scrap at final assembly early in the design phase when changes are least expensive.
In addition to this, specifications deemed less critical can be relaxed, increasing tolerances and allowing the use of less expensive manufacturing processes. Creating 3-dimensional tolerance stack-ups let engineers know where to focus when measuring and designing, and the ability to create what-if studies allow them to determine solutions that include both process and part tolerances to keep quality high and costs down.

3DCS AAO Add-on


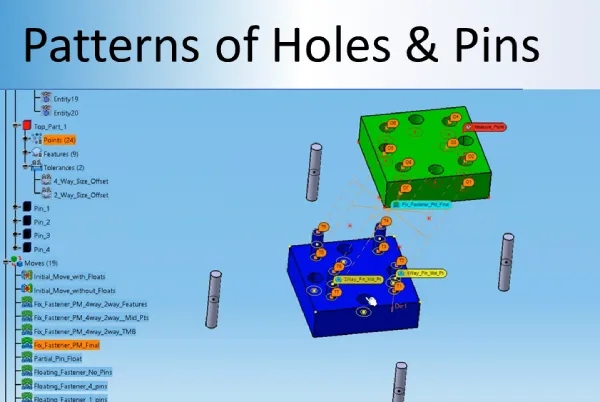
3DCS for NX pulls in NX PMI data to quickly tolerance your Variation Analysis models. This is a fast and effective way to begin your analysis, but also gives engineers the ability to validate the GD&T (PMI), and optimize it to improve product quality, by tightening and testing areas critical to build quality, as well as reduce manufacturing costs, by increasing (loosening) tolerances in non-critical areas.
Values:

Use visualization tools like VRED from Autodesk, or NX’s built in Ray Traced Studio to create photo-realistic images of your model. Apply tolerances and gap and flush conditions to see how your product will look at the extremes, then set maximum and minimum specifications for engineering to hold to in order to guarantee your product’s Perceived Quality.
View the effects of Stack Ups and different conditions on your product to understand how variation will affect its appearance. Utilize this with engineering’s analyses to understand how these same stack ups will affect the products performance. Together, design better looking and functioning products at lower cost with a faster time to market!
Values:
Use 3DCS software to hone in on the source of variation, and then use iterative design changes to optimize your product for manufacture and assembly (DFMA – Design for Manufacture and Assembly).
Making changes to the design based on your simulation results, the answers become a button push away. Change the design in NX, adjust tolerances, change assembly processes, and quickly see the results. Compare and contrast different build strategies, locators, datum plans, tolerances and other inputs to see how they affect your final product.
Values:
Create the reports you need from 3DCS with the push of a button: html, pdf, PowerPoint ppt or Excel. Use the reports to share information with colleagues, present on progress and your modeling strategy, to archive the model’s information and inputs, or to summarize the results for managers and customers.
These reports are powerful tools for business as well. Used to generate coordinated measurement plans, they can be used to standardize measurement procedures and CMM routines for suppliers and OEM’s. Use your reports instead to negotiate tolerances with your customers, whether they are suppliers, or OEM’s, showcasing why tolerances need, or can be, loosened or tightened.
All of this without having to spend hours and days compiling images and data. With the push of a button, you have all the information you need. Customization options let you configure your outputs to meet each need, letting you create a variety of reports and outputs from a single model.
Values:
Find the source of variation, honing in on either particular part tolerances, or processes. Many times the source of variation is in the assembly process and the solution does not require the changing of tolerances. This can give engineers the ability to improve quality without having to make costly tolerance adjustments. In addition, tolerance and process changes can be made in the model and simulated to find optimal conditions to get the greatest increase in quality at the lowest cost.
Value:

Determine the geometric relationship between tolerances and the overall assembly. How much of an effect will changing particular tolerances have on the product’s dimensional quality?
“As CAD technology continues to advance to include greater levels of analysis, our open API strategy allows us to support the incorporation of tools like 3DCS software to keep up with the growing demands of customers. The partnership between Siemens and DCS will allow an integrated environment, giving NX users access to advanced analysis as part of the CAD environment.”
Bob Haubrock - Vice President, Product Engineering Software, Siemens PLM Software
OUT NOW : Inspection Flow is live. Centralize your metrology data and close the quality loop.