Software
Services
Resources
Improve Your Product’s Perceived Quality Through Visualization Studies in Leading Tools: Deltagen, VRED, CATIA 3DEXPERIENCE, Keyshot, Design Studio and More
Perceived Quality is the quality attributed to a product based on its perceptual experience. This incorporates the experience a customer has with a product and how it makes them feel about that product.
Bringing together the shape, the appearance, the texture, and physical feel of the product as well as the emotional experience of using the product, Perceived Quality directly affects the opinion of the value of the product. This perceived value then drives the business forward.
Visualization Export gives engineers the ability to view simulations of their final product’s variation to make decisions about design early in the Product Life Cycle that will ultimately affect their customers’ Perceived Quality of the product.


Perceived Quality Studies are a means of communicating quality objectives and attainable quality levels between Design and Engineering teams. This process incorporates iterative studies to determine acceptable aesthetic levels and then confirms manufacturing’s ability to meet those objectives.
View Expected Variation to Determine Specification Tolerances
Simulation Studies
Complete the Tolerance Analysis Model by adding assembly processes and production tolerances within the given design parameters.
Process:
Steps in a Perceived Quality driven PLM Cycle:
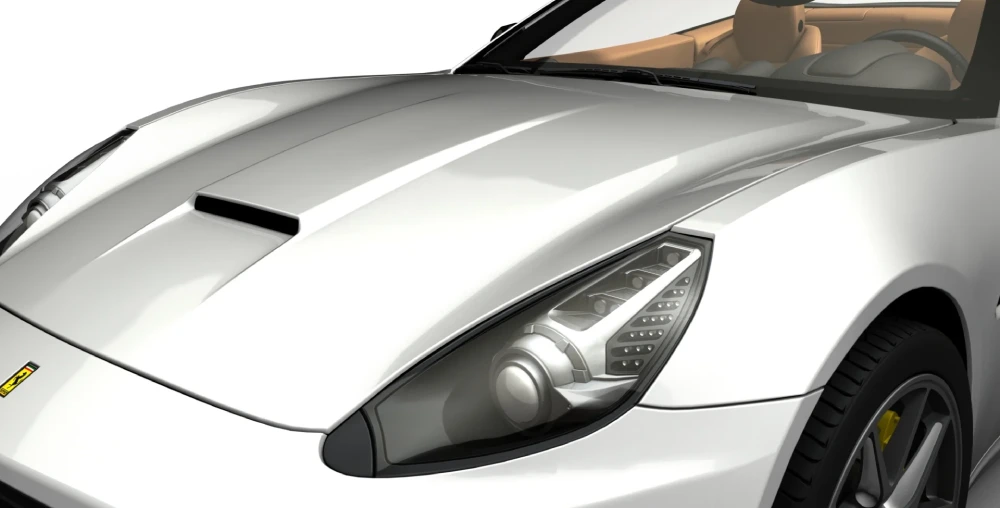
See Gap and Flush studies using powerful visualization. Change gap and flush dimensions with the click of a button to view different specifications and determine their impact on Perceived Quality.
Use single button updates to quickly swap out part variants and view them with variation, seeing how your product will look when manufactured. Save valuable time waiting on prototypes.
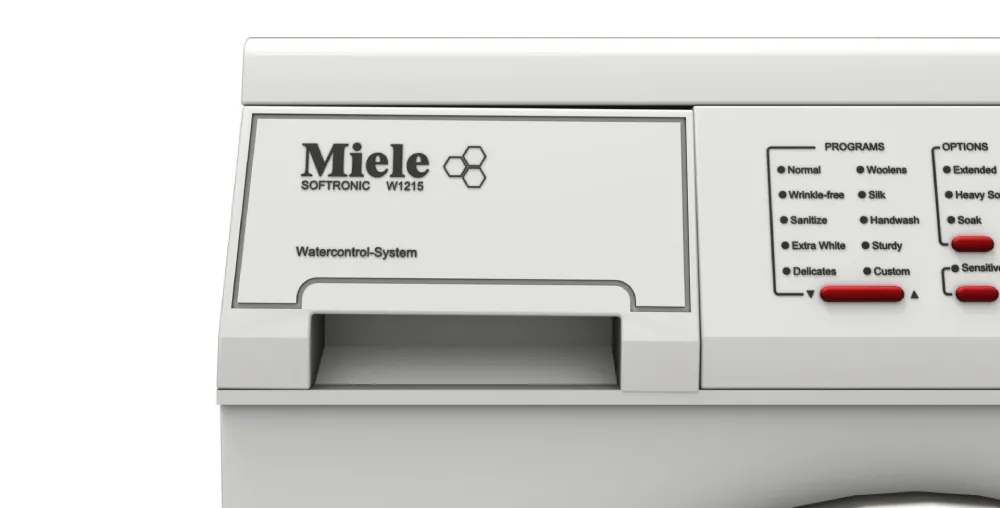
Use 3DCS Spec Studies to set conditions across your product, seeing how multiple gaps, and flushes, as well as part angles can affect the appearance of your product.
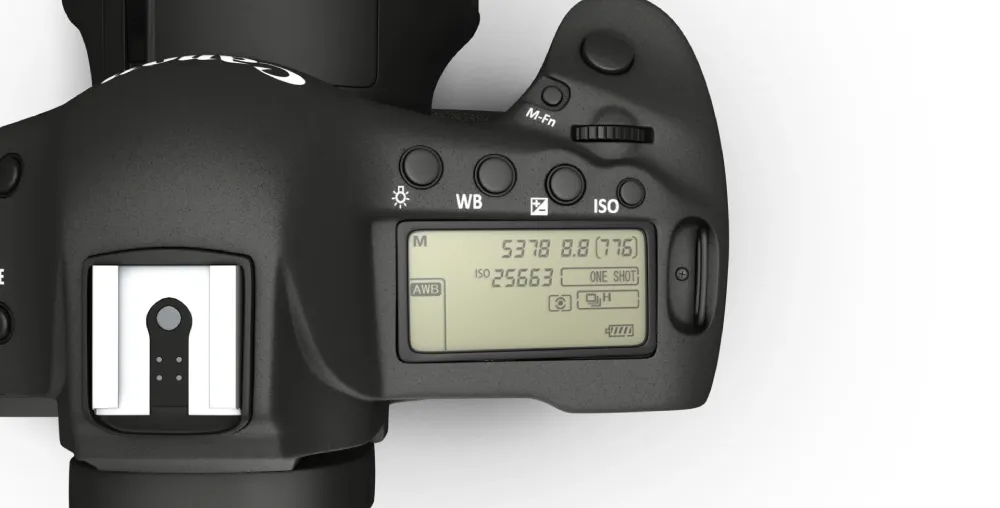
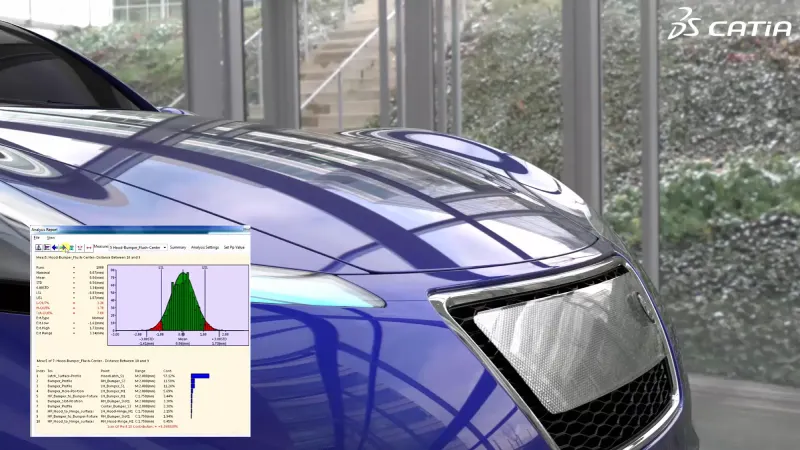
Combine Monte Carlo analysis results with visualization to pick out specific samples to view using High-End Visualization tools.
With easy to use outputs from 3DCS, use any visualization tool that you're comfortable with.
Swap between different product variants, part variants, and studies fast without having to model each part in a different position, or remodel the entire product.
Too many correction loops? The Manufacturing Quality Pack is now live.
OUT NOW : Inspection Flow is live. Centralize your metrology data and close the quality loop.